Decision Tree
Decision Tree

A decision tree is a decision support tool that uses a tree-like model of decisions and their possible consequences, including chance event outcomes, resource costs, and utility. (Source: Wikipedia)
Decision tree can be used in solving classification as well as regression problems. In most of the cases for classification purpose, we use decision tree. In this algorithm a tree structured classifier is generated by the model.
In a decision tree, there are 2 nodes that we need to consider.
- Decision node (nodes with further extension to another node)
- Leaf node (last node in tree which provides final class labels)
The target of the algorithm is to reach the leaf node asap. Entire data is provided to the root node(decision node) and where splitting action happens.
To construct a decision tree, there is an algorithm called as ID3 (Iterative Dichotomiser 3). First step is to select the right attribute/feature for splitting the decision tree. For this we need to use the entropy technique. This point is very important because if we are able to select the right feature from the beginning, we can reach to the leaf node quickly which is the motive of decision tree algorithm.
Entropy
It helps in measuring the purity of the split. Pure split means either we are getting Yes or No, there should not be any combination of both. So to attain a pure split, the splitting continues (till we reach the leaf node). Entropy value is between 0 and 1.
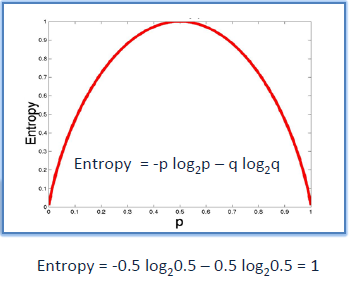
p = percentage of positive class
q = percentage of negative class
In the above image, we can see there is 50-50 probability of Yes and No. This considered as the worst split(complete impure split) where entropy value will be equal to 1. For pure split, the entropy value will be 0(either a Yes or No). That is where we stop splitting because we have reached leaf node. Lower entropy better the feature splitting.
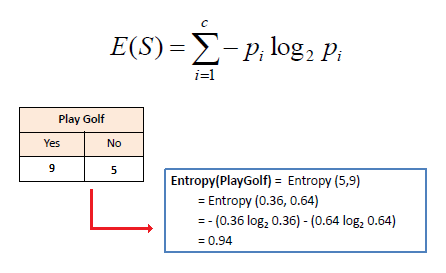
Source: saedsayad
For example, from the above calculation, if there are any feature that is giving better entropy value (lower than 0.94) will be selected for further splitting instead of the "PlayGolf". Summation of entropy of all values from root to leaf node need to be done which is done by information gain.
Information Gain
In the beginning, I have mentioned entropy is used only to get the best split or to find the purity of split, But now we have number of split within a tree. So, in that case we need to select a particular pattern. Here comes the concept of information gain. Information Gain means we will compute the average of all the entropy based on the split.

Source: miro.medium.com
T is the subset
Tv is the subset after splitting
Higher the information gain, that pattern(or structure of decision tree) of splitting is selected in the case of IG.
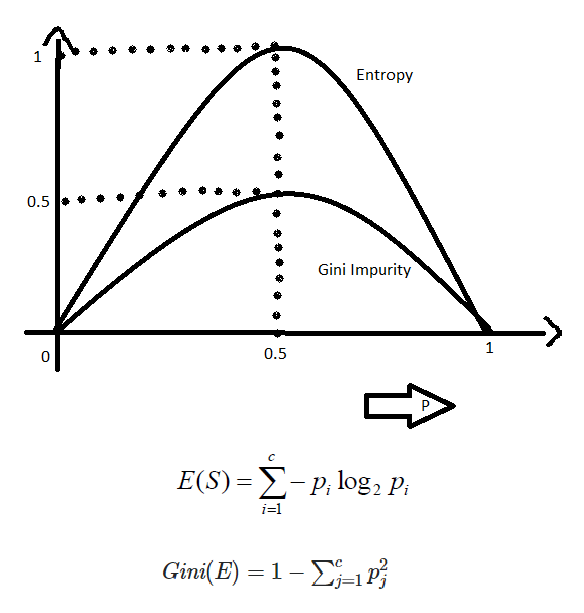
Gini Impurity
We have studied how entropy calculate the purity of split and here we have Gini impurity which do the same work. But most of the time GI is better than entropy.

Source: media.geeksforgeeks.org
p = probability of positive value + probability of negative value
Source: media.geeksforgeeks.org
Gini entropy is used in majority of cases because this is computationally more efficient than entropy. Because in entropy we have log2 in the formula which will take time for the algorithm to compute. Hence GI takes shorter period of computation time.
Decision Tree split for Numerical Features
So far we have mentioned about the data with categorical features. Now let us see how the algorithm works when the features of data are numerical in nature. To split this type of data few steps need to be followed.
- Sorting all the values in ascending order
- Take a threshold value which is the lowest among all(that is in the first position after ordering) eg. 2.4. If the value is less or equal than 2.4 then we take that split as Yes and greater than 2.3 as No.
- Then we take next split, we take threshold as the next number(eg, 3.4)
- Calculation of entropy/gini index and information gain is calculated. The split giving best value is selected.

Source: media.geeksforgeeks.org
The issue with this computation is the time complexity. This will increase when we have more data.
References:
- YouTube Channel - Krish Naik
- Wikipedia


Comments
Post a Comment