Forecast Accuracy Metrics
Forecast Accuracy Metrics

We will be discussing here about the most commonly used forecast accuracy metrics mentioned below:
- Forecast bias
- MAD
- MAPE
- MSE
- RMSE
- MPE
- Forecast Bias
- This metric will help us in understanding whether the model has over estimated or under estimated. If the value is positive then its overestimation and if its negative then underestimation.
- In order to get bias as a % of sales, we have Forecast Bias %


- If the value is more than 100 % then its an over forecast and if its less than 100% its under forecast.
- It is important metric in demand forecasting as it will tell us the over or under supply at the central warehouse or distribution centers. It does not give information on quality of detailed level of forecast.
- Target is to achieve a 1 or 100% and the number -/+ tells the deviation.
2. Mean Absolute Deviation (MAD)
- This metrics will tell how large the error is in the forecast on an average.
- It is not considered for comparison as this gives an average error. For eg, if an of error 500 units is large for a sales of 1,000 units but is marginal for a sales of 50,000 units.

- MAE is generally used to compare the result of different forecast model on same product/data and not on different.
- MAE value goes from 0 to infinity and hence it will be difficult to interpret the result at times. So, we have MAPE value which will give result of deviation in percentage.
3. Mean Absolute Percentage Error
- This metric will tell how many percent your forecast is off from actual sales value (on average). This is most commonly used in demand forecasting.

- One drawback of this metric is that it is impossible to calculate MAPE when the sales is zero.
- This is the Arithmetic average, which will give same weightage for each sales of a product and gives high error for slow movers.
- There is another MAPE which is volume-weighted average, which gives more weight to high sales. Drawback for this average is that large error in case of slow movers can get unnoticed.
- Target is to achieve 0% error.
How to calculate MAPE or MAD (detailed or aggregated level)?
- Detailed metric average calculation

- Aggregated average calculation

We can see in both the cases the error value is very different and hence it will change the complete interpretation of the forecast. We use detailed metric average calculation for changes like store replenishment which is depended on each of the product MAPE or MAD. Aggregated average calculation is used for business decisions on an aggregated level like planning to take resources from the distribution centers.
4. Mean Percent Error (MPE)
This metric is similar to MAPE but without absolute. This is used to give an additional feature of positive and negative deviation comparison.

5. Mean Square error (MSE)
- MSE value is more than MAE due to squaring the error value (especially in case of outliers).
- In case of MSE, error increases in a quadratic fashion unlike MAE where it is proportional increase.
- Predicted error is heavily penalized in this case.
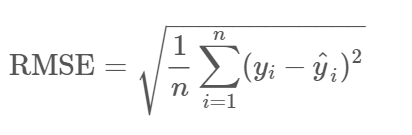
6. RMSE
- RMSE is better than MSE as in case of RMSE, the error units and actual units matches unlike MSE.
- RMSE represents standard deviation of residuals hence tell how large the residual is dispersed.
Reference:
- relexsolutions
- Youtube
- Wikipedia


Comments
Post a Comment